
To achieve a bay-wide perspective on tidal marsh attributes across the Delaware Estuary, I developed a series of maps that illustrate an array of ecological components relavent to marshes. Taken together, the perspective offered by these maps can help reveal new approaches to the conservation and restoration of this landscape.
Below I describe the array of ecological attributes that I mapped and what they tell us about the conservation challenges faced by tidal marshes and their constituent plants and animals.
My work mapping Delaware Bay tidal marshes is ongoing as I now investigate how past uses (and abuses) of marshes have contributed to present-day marsh vulnerability to sea level rise.
All maps below are interactive and can be zoomed with the mouse wheel and opened in a new tab with the “expand” button.
A fundamental factor determining the condition of waterways and the estuaries they ultimately flow into is non-point source pollution – that is, all the runoff that drains from agricultural land along with city streets and parking lots.
For example, waterways in a predominately agricultural landscape will have much higher nutrient loads that can dramatically change the character of aquatic ecosystems. Downstream, in tidal wetlands, research has shown that over fertilized marsh tends to get weaker roots and soupier mud that result in a marsh that has a diminished capacity to keep pace with sea level rise.
The map below shows the proportion of forested landcover across watersheds that drain into the Delaware Bay. It reveals that, particularly on the NJ side, there are large areas that are predominately forested. For Delaware and the upper bay section of New Jersey, the landscape is dominated by agriculture. It is no accident that the forested region is still covered in trees; It is a lucky bit of geology. The soils in this region are simply too poor for widespread conversion to farmland.
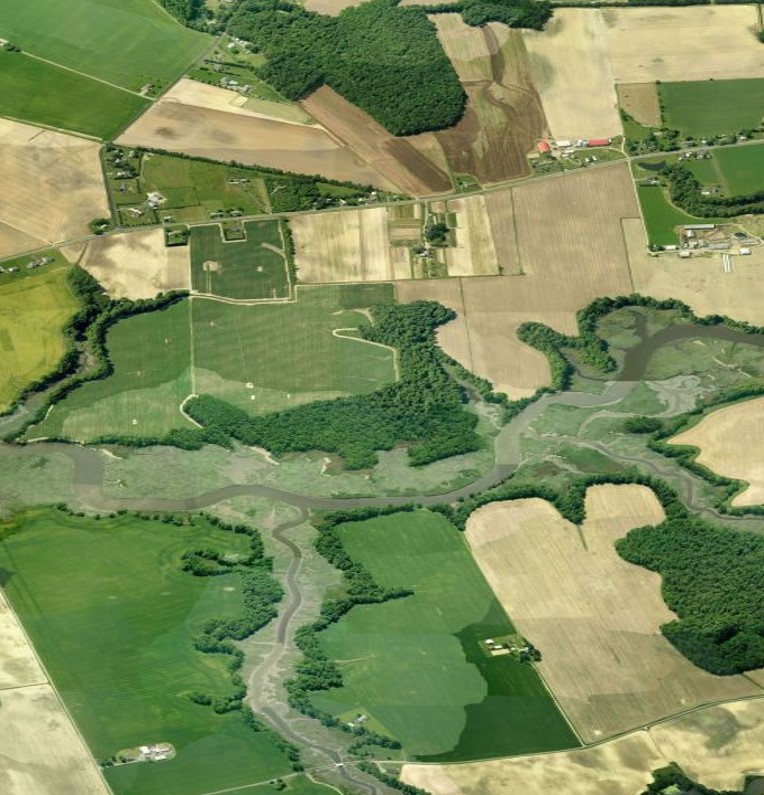
The next map illustrates how far inland tidal waters reach. Along the larger waterways, like the Maurice River (below Millville on the map), this can be a considerable distance. This distance allows tidal marshes to exist along a broad salinity gradient from salt to brackish to freshwater. The salinity gradient boosts the biological diversity of marshes because e brackish and freshwater tidal sections have unique plant and animal communities found nowhere else. They are the rarest tidal marshes in the Delaware Estuary.
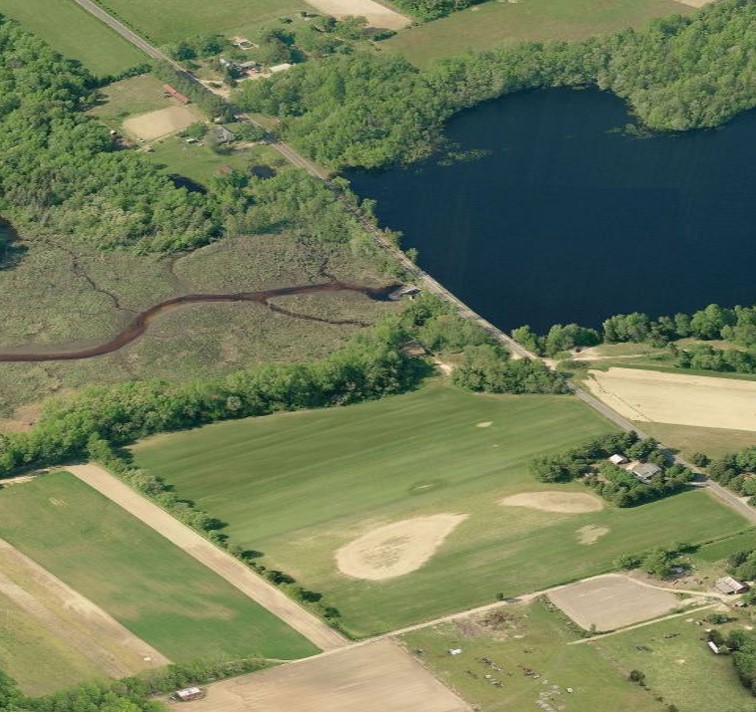
Small dams are ubiquitous along the coastal watersheds around the Delaware Bay. Many were built long ago, even during colonial times, when dams were built to power mills. Dams impact tidal marshes because they limit the flow of freshwater into the estuary and they limit the formation of tidal freshwater marshes at the upper reaches of waterways.
All dams, when they were built, were established above the “head of tide” (the upper extent of tidal action in the waterway). But with sea level rise over the last several hundred years, the tide has moves upstream and is now pushing against many dams. The result is that the brackish and freshwater marshes are being squeezed out of existence.
Alternatively, an undammed watershed allows for change to happen as the tides move upstream with progressing sea level rise.
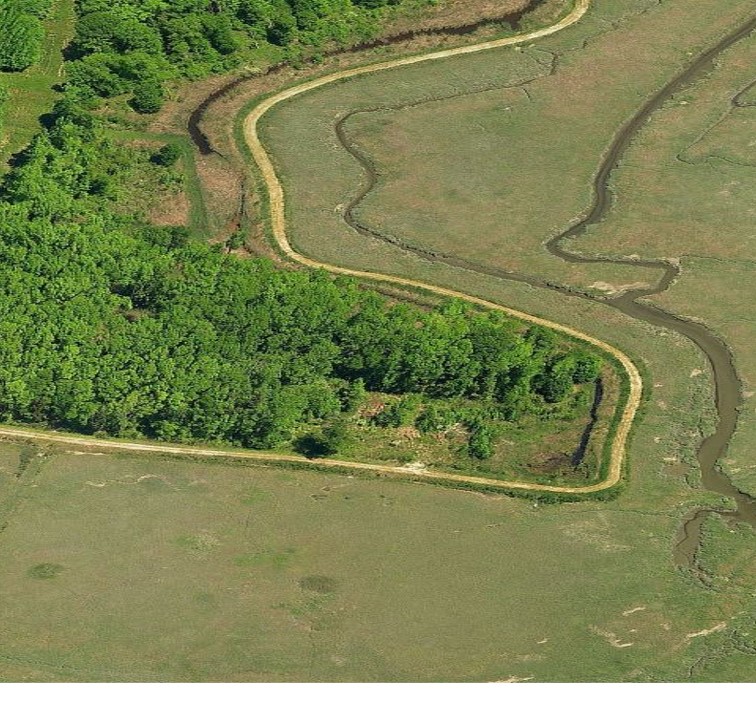
Sea level rise has been a fact of life along the Delaware Bay since it was first settled. The shoreline is perpetually retreating while the uplands give way to advancing marsh. This is the result of geological subsidence along with climate change-induced sea level rise. The bottom line is that like, dams, any upland barrier to ecological change, like roads and levees, will prevent these coastal habitats from finding a new equilibrium as the sea rises. With barriers, there will be less tidal marsh in the future. Fortunately there is light development in many parts of the bay coastline and, at least in some places, there is room for change to happen (illustrated on the map below).
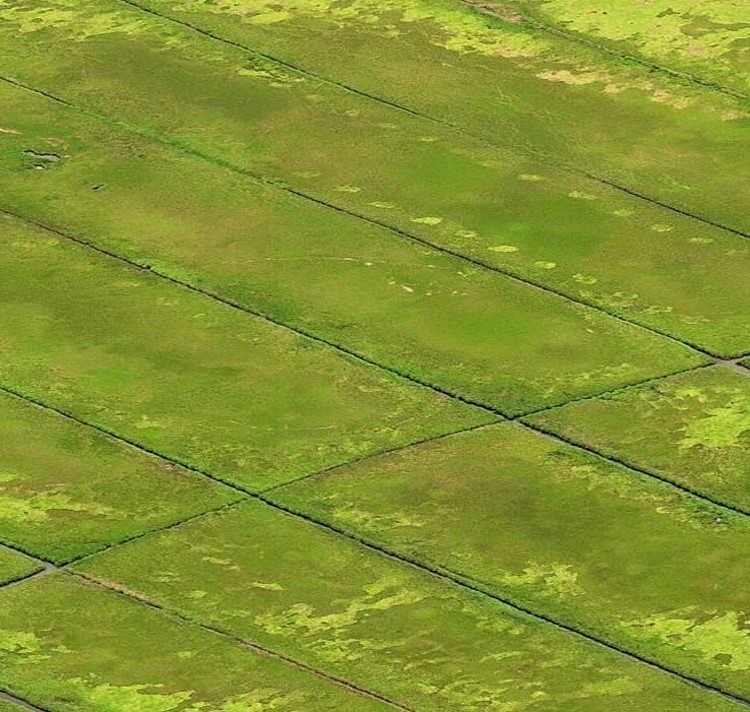
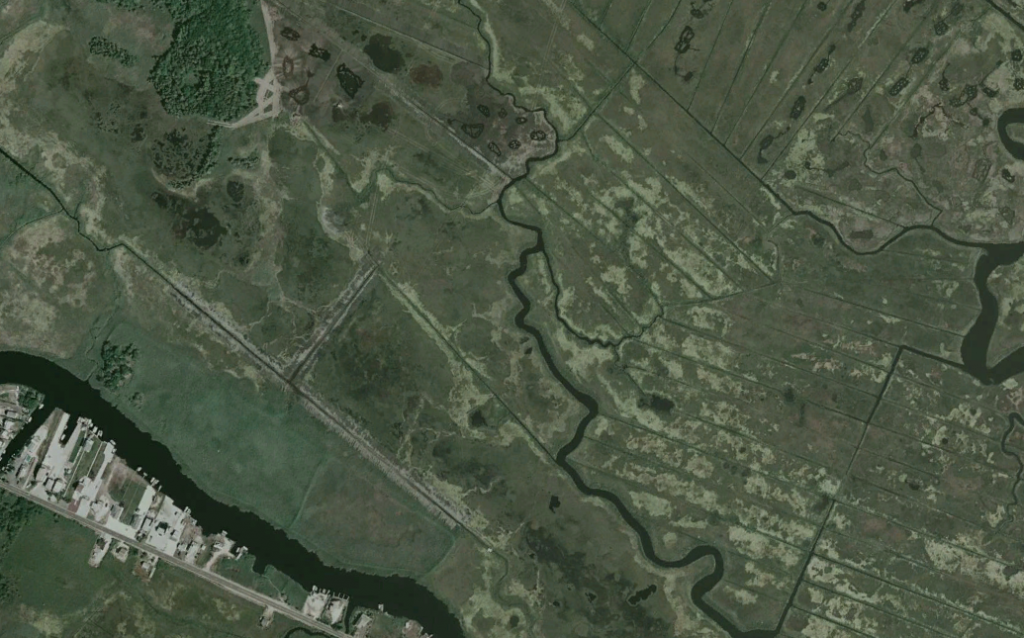
Ditches are among the most visible human impacts to marshes. In the past, ditches were dug to create drainage for salt hay farms and for mosquito control. Parallel grid ditching was a widespread mosquito control activity in the early 20th century that did little to control mosquito but left lasting scars on marshes. In the Delaware Bay there is very little grid ditching on the NJ side, but the activity was more widespread on the Delaware side.
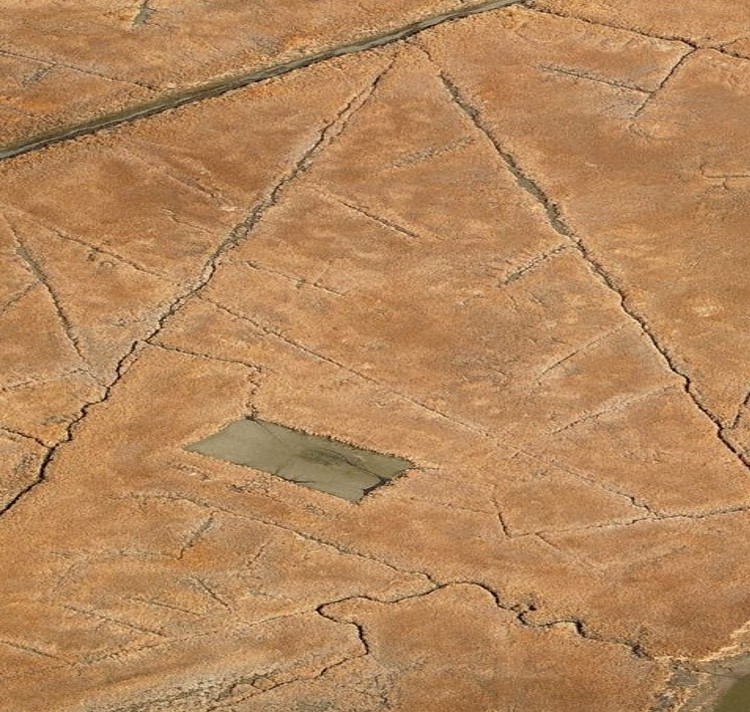
“Open water marsh management” (OMWM) is still practiced as a mosquito control activity. It is a form of ditching and pond creation that targets infrequently flooded high marsh habitats. OMWM may come under renewed scrutiny as the species that depend on high marsh such as salt marsh sparrow and black rail become increasingly threatened by habitat loss and sea level rise.
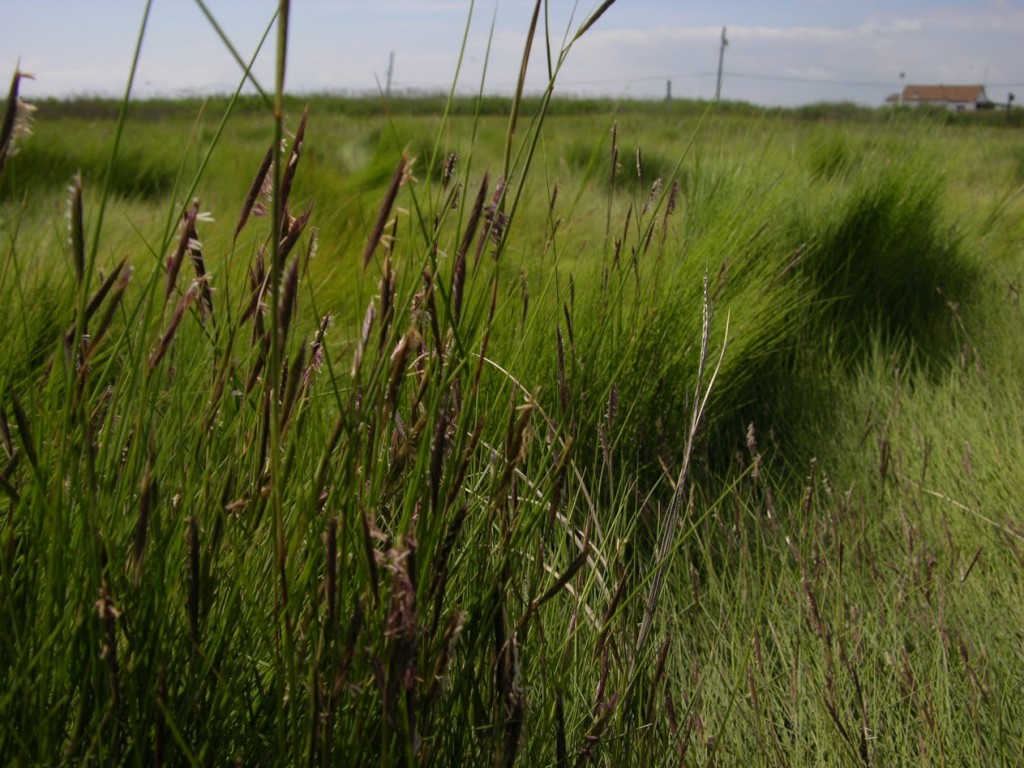
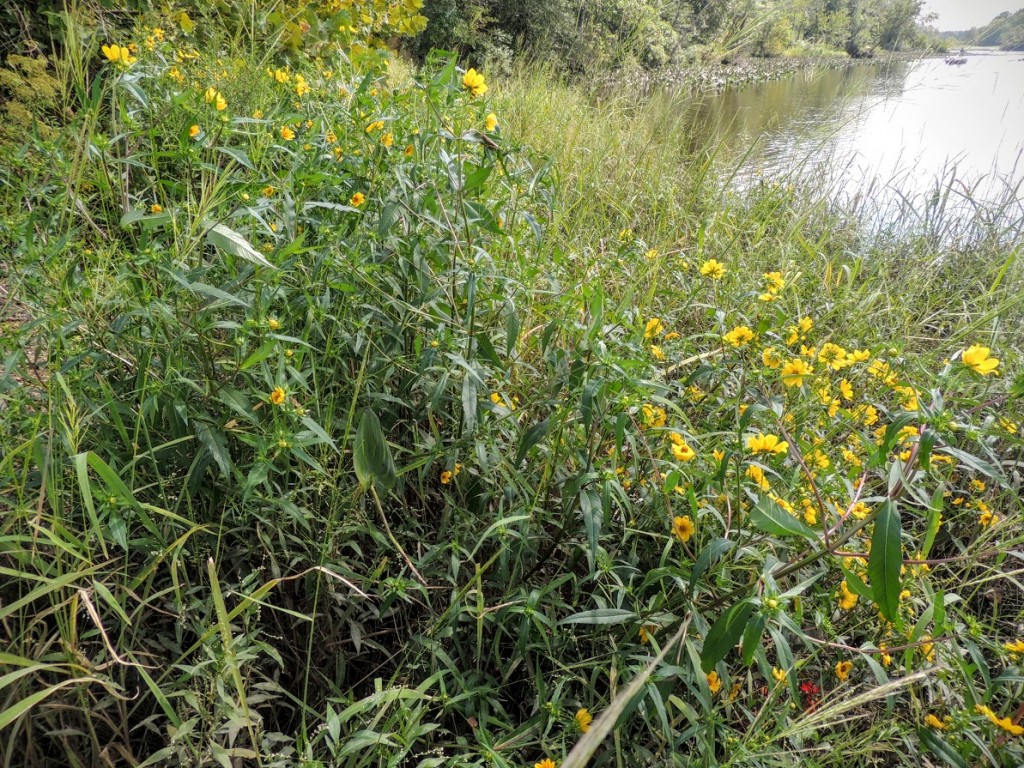
High marsh exists at the upper range of tidal marsh elevations and is less frequently flooded than low marsh dominated by Spartina alterniflora. The high marsh contains a a more diverse suite of plant species including grasses, wildflowers and shrubs. It is a key breeding habitat for several rare bird species including salt marsh sparrow, northern harrier and black rail. Being at the extreme upper range of marsh elevation, it is also the most resilient to sea level rise.
This map is the first-ever effort to map high marsh in the Delaware Bay. The distribution of high marsh in the bay tells us much about human impacts to the salt marsh. Former salt hay farms, which ironically farmed high marsh vegetation, are now predominated by low marsh vegetation and this history of marsh use has greatly reduced the extent of high marsh in the bay. I describe why in this blog post.
Tidal salt marsh is a mosaic of high and low marsh, large and small water bodies, tidal and non-tidal ponds. Each of these contributes a different suite of habitat characteristics desirable to a range of animal species. The high marsh, as mentioned above, attracts unique nesting birds species. Non-tidal salt marsh pools are duck magnets, offering submerged aquatic vegetation particularly loved by black ducks and other dabblers. Tidal ponds offer foraging opportunity for shorebirds and low marsh has its own suite of bird species such as seaside sparrow and clapper rail.
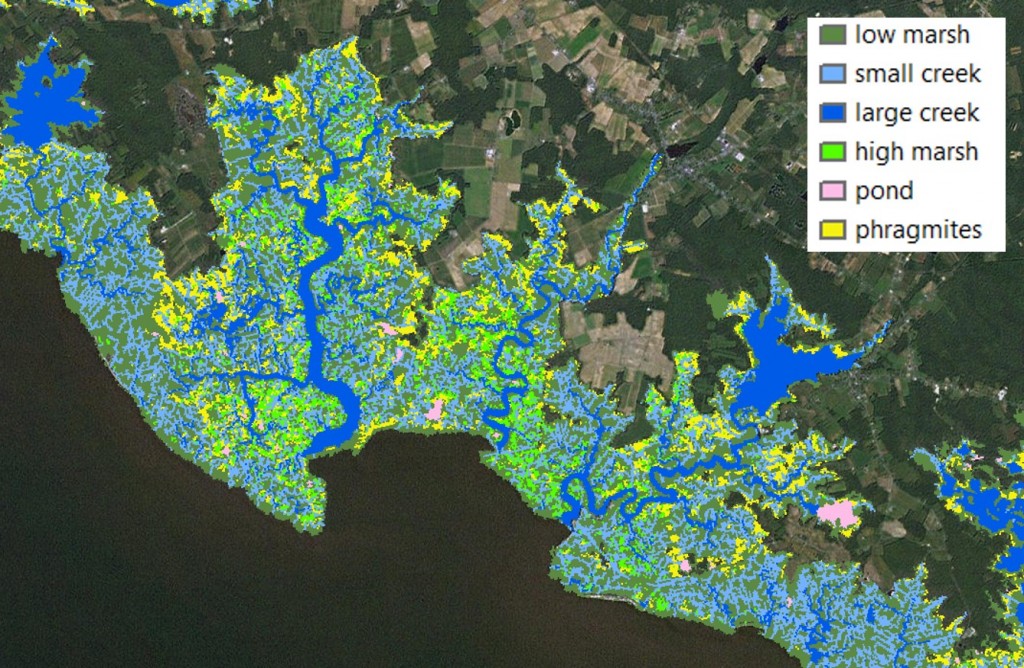
Given these species-specific habitat affinties, I mapped the relative diversity of habitats as a proxy for the diversity of animals that use them. To do this, I pulled together multiple data sources to map the various marsh habitats and then calculated a “moving window” average of habitat diversity for marshes across the bay. The highest diversity areas are those places that were not impacted by ditching or salt hay farming because those areas are most likely to retain ponds and high marsh.
In my introduction I promised new conservation insights. I will leave it to the reader and map viewer to draw their own conclusions, but here are a few of mine.
First of all, being New Jersey-based, this project greatly increased my understanding of marshes on the Delaware side of the estuary. The conservation issues on the two sides are somewhat different. For example, much more of Delaware’s marshes are still impounded, while most impoundments on the New Jersey side have already breached and the marsh has (or has not) recovered. Also Delaware has a much greater amount of agriculture and shoreline development.
The most important insight these maps help illustrate is that the areas of marsh that have endured fewer human impacts contain a much greater habitat diversity and are better able to keep pace with sea level rise (due to their higher elevations). Although the bay’s marshes are vast, the proportion that is in excellent ecological condition with maximum resilience to sea level rise is quite small. Restoration offers the opportunity to address the sins of the past by enhancing the ecological integrity and resilience of marshes. Maps like these help us identify those place that could benefit from restoration most.